


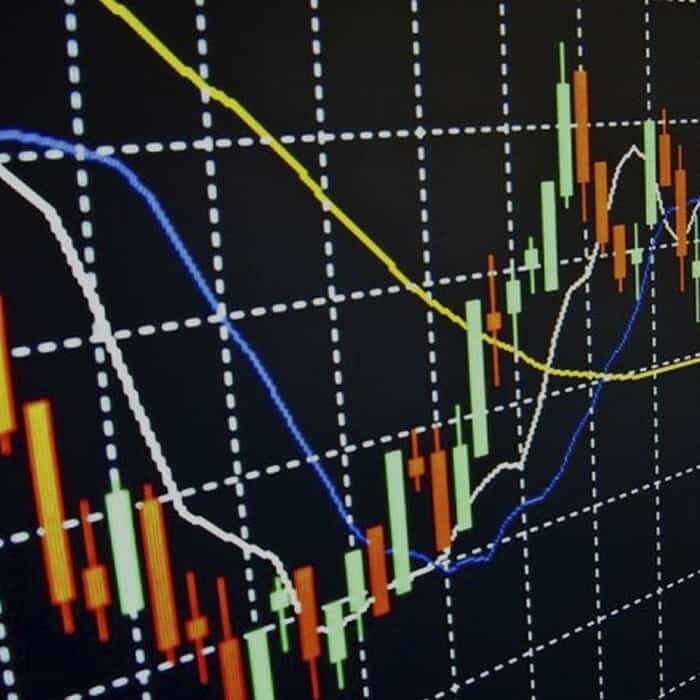
Moving averages are one of the most popular tools for investors because they are very useful in trying to spot the trend of a market. In this article, we are going to explain the basics about them and how some people use them in their decision-making process.
What is a Moving Average?
You can get an average of the price by adding the prices of several days and dividing by the number of days. If we want the average of three days it would be this formula:
Average (price day one + price day two + price day three) / 3.
Now you need the average to move; how do you do that? Easy: The next day, you remove the price of day one and add the price of day four. If you do this several times, you will have a sequence of numbers. If you take these numbers and use them in a graph in which the Y-axis is the price and X-axis is the time, you can generate a line.
Now that you have your line in a graph, you can easily see the trend of the price. If it goes up, the price is raising and vice versa. The issue with moving averages is the fact that the price influence in the average two times when it is added and when it leaves the formula because it moves to the future. To avoid this, many investors use exponential moving averages. The calculation is slightly more difficult, but any graph-making software can do it in a matter of seconds.
What Moving Average Timeframe is the Best?
There is no such thing as the best moving average. Each asset and investor can work better with on or another. In general, most people use a moving average of 30 weeks for the long-term, 10 weeks for the mid-term, and 3 weeks for the short term. Of course, this may vary depending on your definition of long-term and short-term.
What the Moving Average Tells You
The moving average serves to spot changes on the trend. When the moving average is going up and reversing to go down, you have a warning that the trend may be changing.
Another important aspect is that the price usually tends to go back to the average. As a result, when the price of an asset is too far from the moving average, you may expect a correction.
In addition, the moving average usually works as a support or resistance when the price gets closer to it.
Using Two Moving Averages
Some investors use two moving averages to get an indicator of a change in the trend. For example, you can combine the moving averages of 30 weeks and the one of 10 weeks. The moving average of 10 week changes faster than the 30 weeks one, so you know that when the 10-week moving average crosses the 30-week one from below to above, you have a bullish indicator.
Be Careful
Moving averages alone do not guarantee that you will get profits in the long term. Investors usually use them in combination with other indicators.
Notice that this article does not expect to be a comprehensive guide, but an introduction to the moving average as a tool. Medallion Guarantee do not recommend investing based only on moving averages.